This course teaches participants techniques for monitoring and improving infrastructure and application performance in Google Cloud. Using a combination of presentations, demos, hands-on labs, and real-world case studies, attendees gain experience with full-stack monitoring, real-time log management and analysis, debugging code in production, tracing application performance bottlenecks, and profiling CPU and memory usage.
Objectives
In this course, participants will learn the following skills:
- Explain the purpose and capabilities of Google Cloud’s operations suite.
- Implement monitoring for multiple cloud projects.
- Create alerting policies, uptime checks and alerts.
- Install and manage Ops Agent to collect logs for Compute Engine.
- Explain Cloud Operations for GKE.
- Analyze VPC Flow Logs and firewall rules logs.
- Analyze and export Cloud Audit Logs instances.
- Profile and identify resource-intensive functions in an application.
- Analyze resource utilization cost for monitoring related components within Google Cloud.
Audience
This class is intended for the following audience:
- Cloud architects, administrators, and SysOps personnel.
- Cloud developers and DevOps personnel.
Prerrequisites
To get the most out of this course, participants should have:
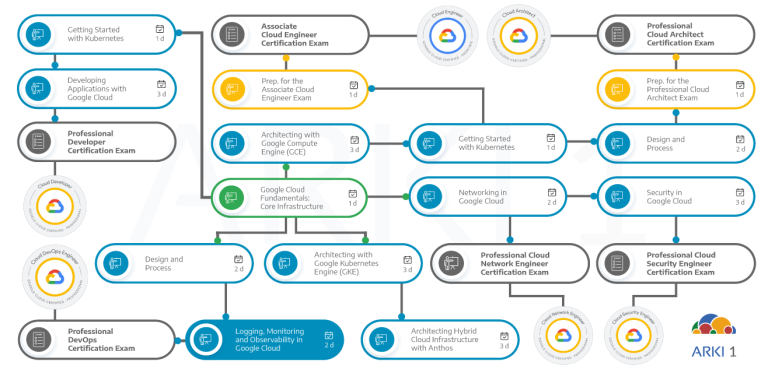
- Have completed the Google Cloud Fundamentals: Core Infrastructure course or have equivalent experience.
- Have basic scripting or coding familiarity.
- Be proficient with command-line tools and Linux operating system environments.
Duration
16 hours (2 days)
Investment
Check the next open public class in our enrollment page.
If you are interested in a private training class for your company, contact us.
Course Outline
The course includes presentations, demonstrations, and hands-on labs.
- Describe the purpose and capabilities of Google Cloud’s operations suite.
- Explain the purpose of the Cloud Monitoring tool.
- Explain the purpose of Cloud Logging and Error Reporting tools.
- Explain the purpose of Application Performance Management tools.
- Use Cloud Monitoring to view metrics for multiple cloud projects.
- Explain the different types of dashboards and charts that can be built.
- Create an uptime check.
- Explain the cloud operations architecture.
- Explain and demonstrate the purpose of using Monitoring Query Language (MQL) for monitoring.
- Explain alerting strategies.
- Explain alerting policies.
- Explain error budget.
- Explain why server-level indicators (SLIs), service-level objectives (SLOs), and service-level agreements (SLAs) are important.
- Identify types of alerts and common uses for each.
- Use Cloud Monitoring to manage services.
- Use Log Explorer features.
- Explain the features and benefits of logs-based metrics.
- Define log sinks (inclusion filters) and exclusion filters.
- Explain how BigQuery can be used to analyze logs.
- Export logs to BigQuery for analysis.
- Use log analytics on Google Cloud.
- Explain Cloud Audit Logs.
- List and explain different audit logs.
- Explain the features and functionalities of the different audit logs.
- List the best practices to implement audit logs.
- Use the Ops Agent with Compute Engine.
- Enable and use Kubernetes Monitoring.
- Explain the benefits of using Google Cloud Managed Service for Prometheus.
- Explain the usage of PromQL to query Cloud Monitoring metrics.
- Explain the uses of Open Telemetry.
- Explain custom metrics.
- Collect and analyze VPC Flow Logs and firewall rules logs.
- Enable and monitor Packet Mirroring.
- Explain the capabilities of the Network Intelligence Center
- Explain the features, benefits, and functionalities of Error Reporting, Cloud Trace, and Cloud Profiler.
- Analyze resource utilization cost for monitoring related components within Google Cloud.
- Implement best practices for controlling the cost of monitoring within Google Cloud.


